Signals of typhoon induced hydrologic alteration in particulate organic matter from largest tropical river system of Hainan Island, South China Sea
Tropical river systems affected by climatic extremes (typhoon) are recognized as significant source of particulate organic matter (POM) delivered to their adjacent seas. Studies on POM composition in typhoon affected rivers of tropical Hainan Island are limited. The Nandu River-Estuary (NRE) is the largest river system on Hainan Island in the South China Sea, affected by frequent typhoons every year. We used elemental contents, stable isotope ratios of organic carbon and lignin phenols to characterize POM compositions in NRE during typhoon affected wet season (August, 2011) vs. normal wet season (October, 2012). Short term and heavy precipitation during typhoon in August, 2011 was evidenced with a significant hydrologic change as well as change in POM composition along the NRE. The multi-proxy results suggest that POM was degraded and their sources significantly changed along the NRE hydrograph. Results from an end member mixing model indicated that POM constituted nearly similar OM input from soil (35%) and freshwater plankton (32%) during August, 2011, in contrast POM dominated with OM from freshwater plankton (51%) during October 2012 in riverine regions of NRE. In the estuarine region, POM constituted dominant inputs from marine plankton during August, 2011 (44%) and October, 2012 (56%) as compared to other sources. Collectively, the nature of POM composition change in the vicinity of typhoon induced copious precipitation, with potential land-use intervention across the Hainan Island are key factors affecting the carbon cycling in NRE and adjacent South China Sea.
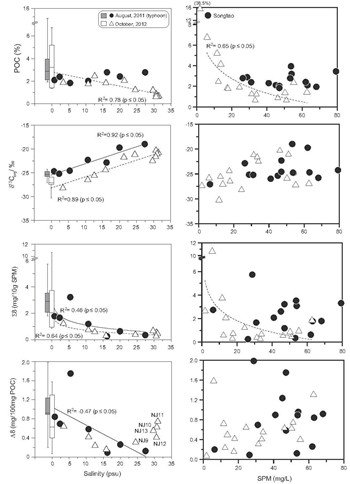
Fig. 4. Interrelationship of organic carbon contents, their isotopes and lignin phenols with salinity (left) and SPM (right) during August, 2011 (circles) and October, 2012 (triangles) campaigns in NRE. The values at riverine stations (with zero salinity) are displayed using box and whisker plot and their median (50% of data or middle of data) values were used for the regression line. Upper limit of box (above the median or horizontal line within box) represented upper quartile i.e. % of the data above median (50% of data or middle of data) and lower limit of box represented lower quartile i.e. % of the data less than the median values.
List of relate publications:
-
JOURNAL OF HYDROLOGY ,
2016 ,
534
: 534